
[Study] How Dangerous Are Multi-Vehicle Pile-Ups?
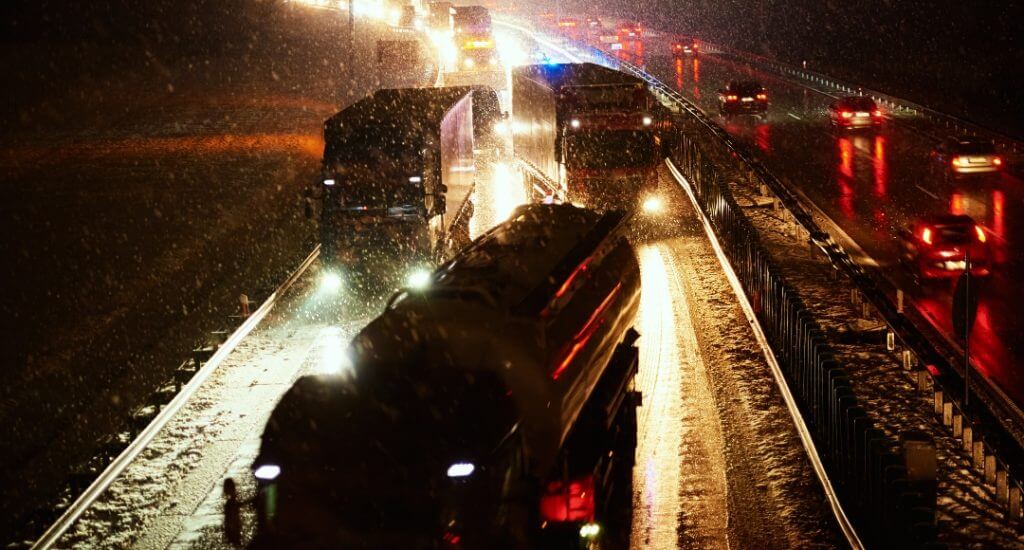
In early January, a stretch of Interstate 5 just outside of Bakersfield, California, was shut down for most of a Saturday after a massive pile-up crash around 7:30 a.m. that involved 17 passenger vehicles and 18 commercial trucks. The morning was plagued with heavy fog, with authorities telling local news reporters that visibility was as little as 10 feet when safety crews arrived on the scene.
Ultimately, two people were killed and an additional nine were injured — the latest example of how adding more vehicles to a crash amplifies the danger, along with other extreme cases like a 130-vehicle pile-up on Interstate 35 West in Fort Worth, Texas, that killed six people on an icy morning in February 2021.
Many of these fatal pile-ups occur in cold-weather months and in weather conditions that shorten visibility while lengthening braking distances, increasing the risk that even more vehicles will end up as part of the crash.
To better understand just how much more dangerous these many-car incidents are, Craft Law Firm examined data from the Fatality Analysis Reporting System (FARS) — a database of all fatal motor vehicle crashes maintained by the U.S. Department of Transportation — to identify 138 fatal crashes from 2005 through 2021 that involved at least 10 vehicles.
While they are relatively rare, when they do occur, they make national news. What else do they have in common?
Key Findings:
- Fatal crashes involving more than 10 vehicles are over 100 times more likely to kill at least five people than fatal crashes involving fewer than five vehicles.
- Fatal pile-ups happen most often during the day, particularly during commuting hours when traffic volumes are highest.
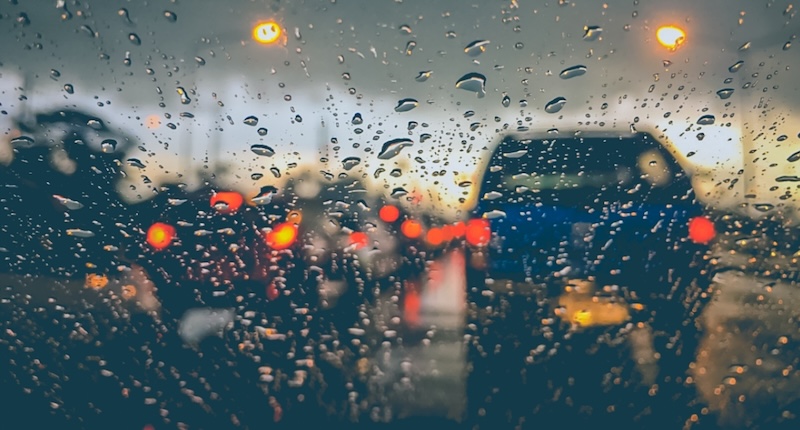
- Fatal pile-ups with 10 or more vehicles tend to happen in the presence of adverse weather conditions that affect driver visibility or braking time.
Where are these crashes happening?
Fatal pile-ups involving more than 10 cars have happened in 38 different states, led by California and Florida with 12 each.
Twenty-five of those states have had multiple fatal pileups: California and Florida with 12; Texas with 11; Pennsylvania with 10; New York with 9; Arizona with 7; Indiana and Ohio with 6; Colorado with 5; Louisiana and Maryland with 4; Arkansas, Georgia, Illinois, Iowa, Michigan, Nevada, New Jersey, Tennessee, Utah, Virginia, and Wisconsin with 3; and Oregon, Washington, and Wyoming with 2.
And there have been 18 counties, many of them in large metropolitan areas, where multiple such accidents have occurred. Cook County, Illinois, home to Chicago, is the only jurisdiction with three fatal pile-ups, while the other counties are spread from California to New York.
High traffic volume and adverse weather conditions make fatal pile-ups more likely.
More fatal pile-ups happen between 7 a.m. and 8 a.m. than any other single hour, according to FARS data, but the most common time of day is the transition from late afternoon to early evening; one-third of the pile-ups take place from 2 p.m. to 7 p.m. These frequent crash times line up with heavy traffic volume on the roads, particularly during post-school and post-work commuting times.
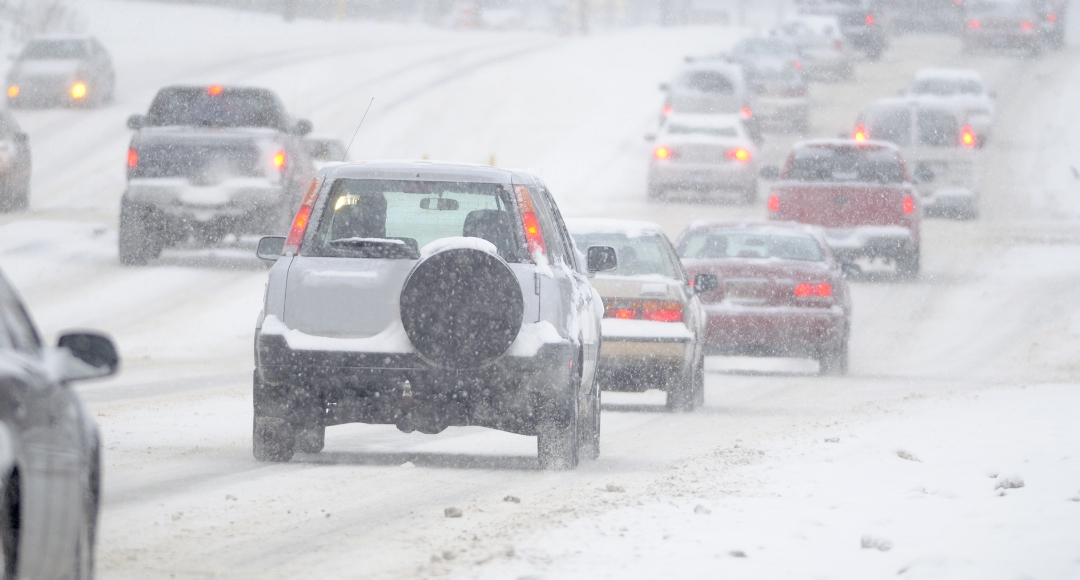
November through February is the most common time of year for fatal crashes involving at least 10 vehicles, which tracks with another factor that links closely to fatal pile-ups: adverse weather conditions.
Roughly two-thirds of all fatal crashes occur under clear or cloudy skies, while just over 50% of fatal pile-ups involve some sort of suboptimal weather, especially those that impact driver visibility and/or braking distance. Fatal crashes with more than 10 vehicles happen in snow, rain, or fog at a much higher rate than fatal crashes with fewer vehicles.
Car and Driver recommends that drivers allow for double the stopping distance when it’s raining, triple when it’s snowing, and even more on icy roads.
More cars involved in an accident significantly increases the likelihood of that accident having multiple fatalities.
FARS data shows that just under 7.5% of fatal crashes involving five or fewer vehicles result in multiple deaths. But as more vehicles are introduced to the equation, that risk compounds. Crashes with more than five vehicles, but no more than 10, kill multiple people three times as often. And more than 30% of pile-ups with more than 10 vehicles kill multiple people — a rate four times as high.
The increased danger is even higher when looking at the percentage of crashes that result in at least five deaths. 3.6% of fatal pile-ups with more than 10 vehicles kill at least five people. That rate may not seem particularly high, but it is six times larger than the percentage of crashes with six to 10 vehicles that do so — and more than 100 times as likely as a crash with five or fewer vehicles.
Even extremes have extremes.
Even within a set of what would already be classified as outlier crashes — the 138 pile-ups we analyzed represent just 0.02% of the more than 750,000 fatal crashes across the country from 2005 through 2021 — there are accidents that stand out.
On eight occasions during that 16-year span, eight pile-up crashes have snowballed to the point where they involved more than 50 vehicles:
A snowball growing in size as it rolls is an apt metaphor for many of these extreme pile-ups, since snow or ice was involved in six of the eight.By the time all 130 cars and 18-wheelers finished stacking up on an icy stretch of interstate in Tarrant County in 2021, the crash scene itself extended half a mile, according to local news reports. There have been claims that the roads were not treated properly to prevent ice buildup, part of more than 1,400 pages of investigative findings from that crash alone that the National Transportation Safety Board has made public since January 2023.But the deadliest such crash was the only one that happened under clear conditions. In the middle of rush hour traffic on August 1, 2007, a section of the Interstate 35 West bridge in Minneapolis collapsed, plunging at least 80 vehicles into the Mississippi River and killing 12 drivers and passengers, as well as a construction worker who was working on the bridge at the time. The NTSB, whose report indicated that there were actually as many as 111 vehicles on the span that collapsed, concluded that the collapse was due to a design error that left the bridge unable to handle increased capacity.
How do I stay safe on the road during bad weather?
 Sometimes, especially if you can see forecasts of snow and ice beforehand, the best option is to stay home if possible. But if you have to be on the road, there are several tips that can help keep you safe when weather conditions are not ideal:
- Accelerate and brake slowly, keeping a greater distance between you and the vehicle in front of you. Remember that stopping distances can double on wet roads, triple in the snow, and climb even higher when there’s ice.
- Avoid cruise control in wintry weather. It’s good to maintain full control of your vehicle when conditions are bad.
- Don’t let all-wheel or four-wheel drive fool you into thinking that you have more traction on the road than you do.
- When there’s dense fog out, reduce your speed and use the right edge of the road as a guide. Use low-beams (and fog lights if you have them), but do not ever use your high-beam lights.
- Minimizing potential driver distractions is important all the time, but becomes even more crucial in poor conditions. Turn down the radio, put away your phone, and focus on the road.
Data sources and methodology
Fatal crash data comes from the Fatality Analysis Reporting System, the National Highway Transit Safety Administration’s database of information on every fatal motor vehicle crash in the United States. We looked at each annual dataset from 2005 until 2021 (the most recent year for which data has been released as of January 2024) and identified the crashes that involved more than 10 vehicles, then used other variables to look at crash elements like time of day, location coordinates, road type, etc.
| Location | Month | Time of day | Road type | Weather conditions | Vehicles involved | Fatalities |
|---|---|---|---|---|---|---|
| Tarrant County, Texas | February 2021 | 6:00 a.m. | Interstate | Ice (from local media reports) | 130 | 6 |
| Fresno County, California | November 2007 | 7:00 a.m. | State highway | Fog/smog/smoke | 92 | 2 |
| Hamilton County, Ohio | January 2013 | 11:00 a.m. | Interstate | Snow | 90 | 1 |
| Hennepin County, Minnesota | August 2007 | 6:00 p.m. | Interstate | Clear | 80 | 13 |
| Lebanon County, Pennsylvania | February 2016 | 9:00 a.m. | Interstate | Snow | 64 | 3 |
| Union County, Pennsylvania | December 2019 | 1:00 p.m. | Interstate | Blowing snow | 59 | 2 |
| Kalamazoo County, Michigan | January 2015 | 9:00 a.m. | Interstate | Snow | 58 | 1 |
| Potter County, Texas | January 2008 | 5:00 a.m. | Interstate | Snow | 51 | 1 |